


Members
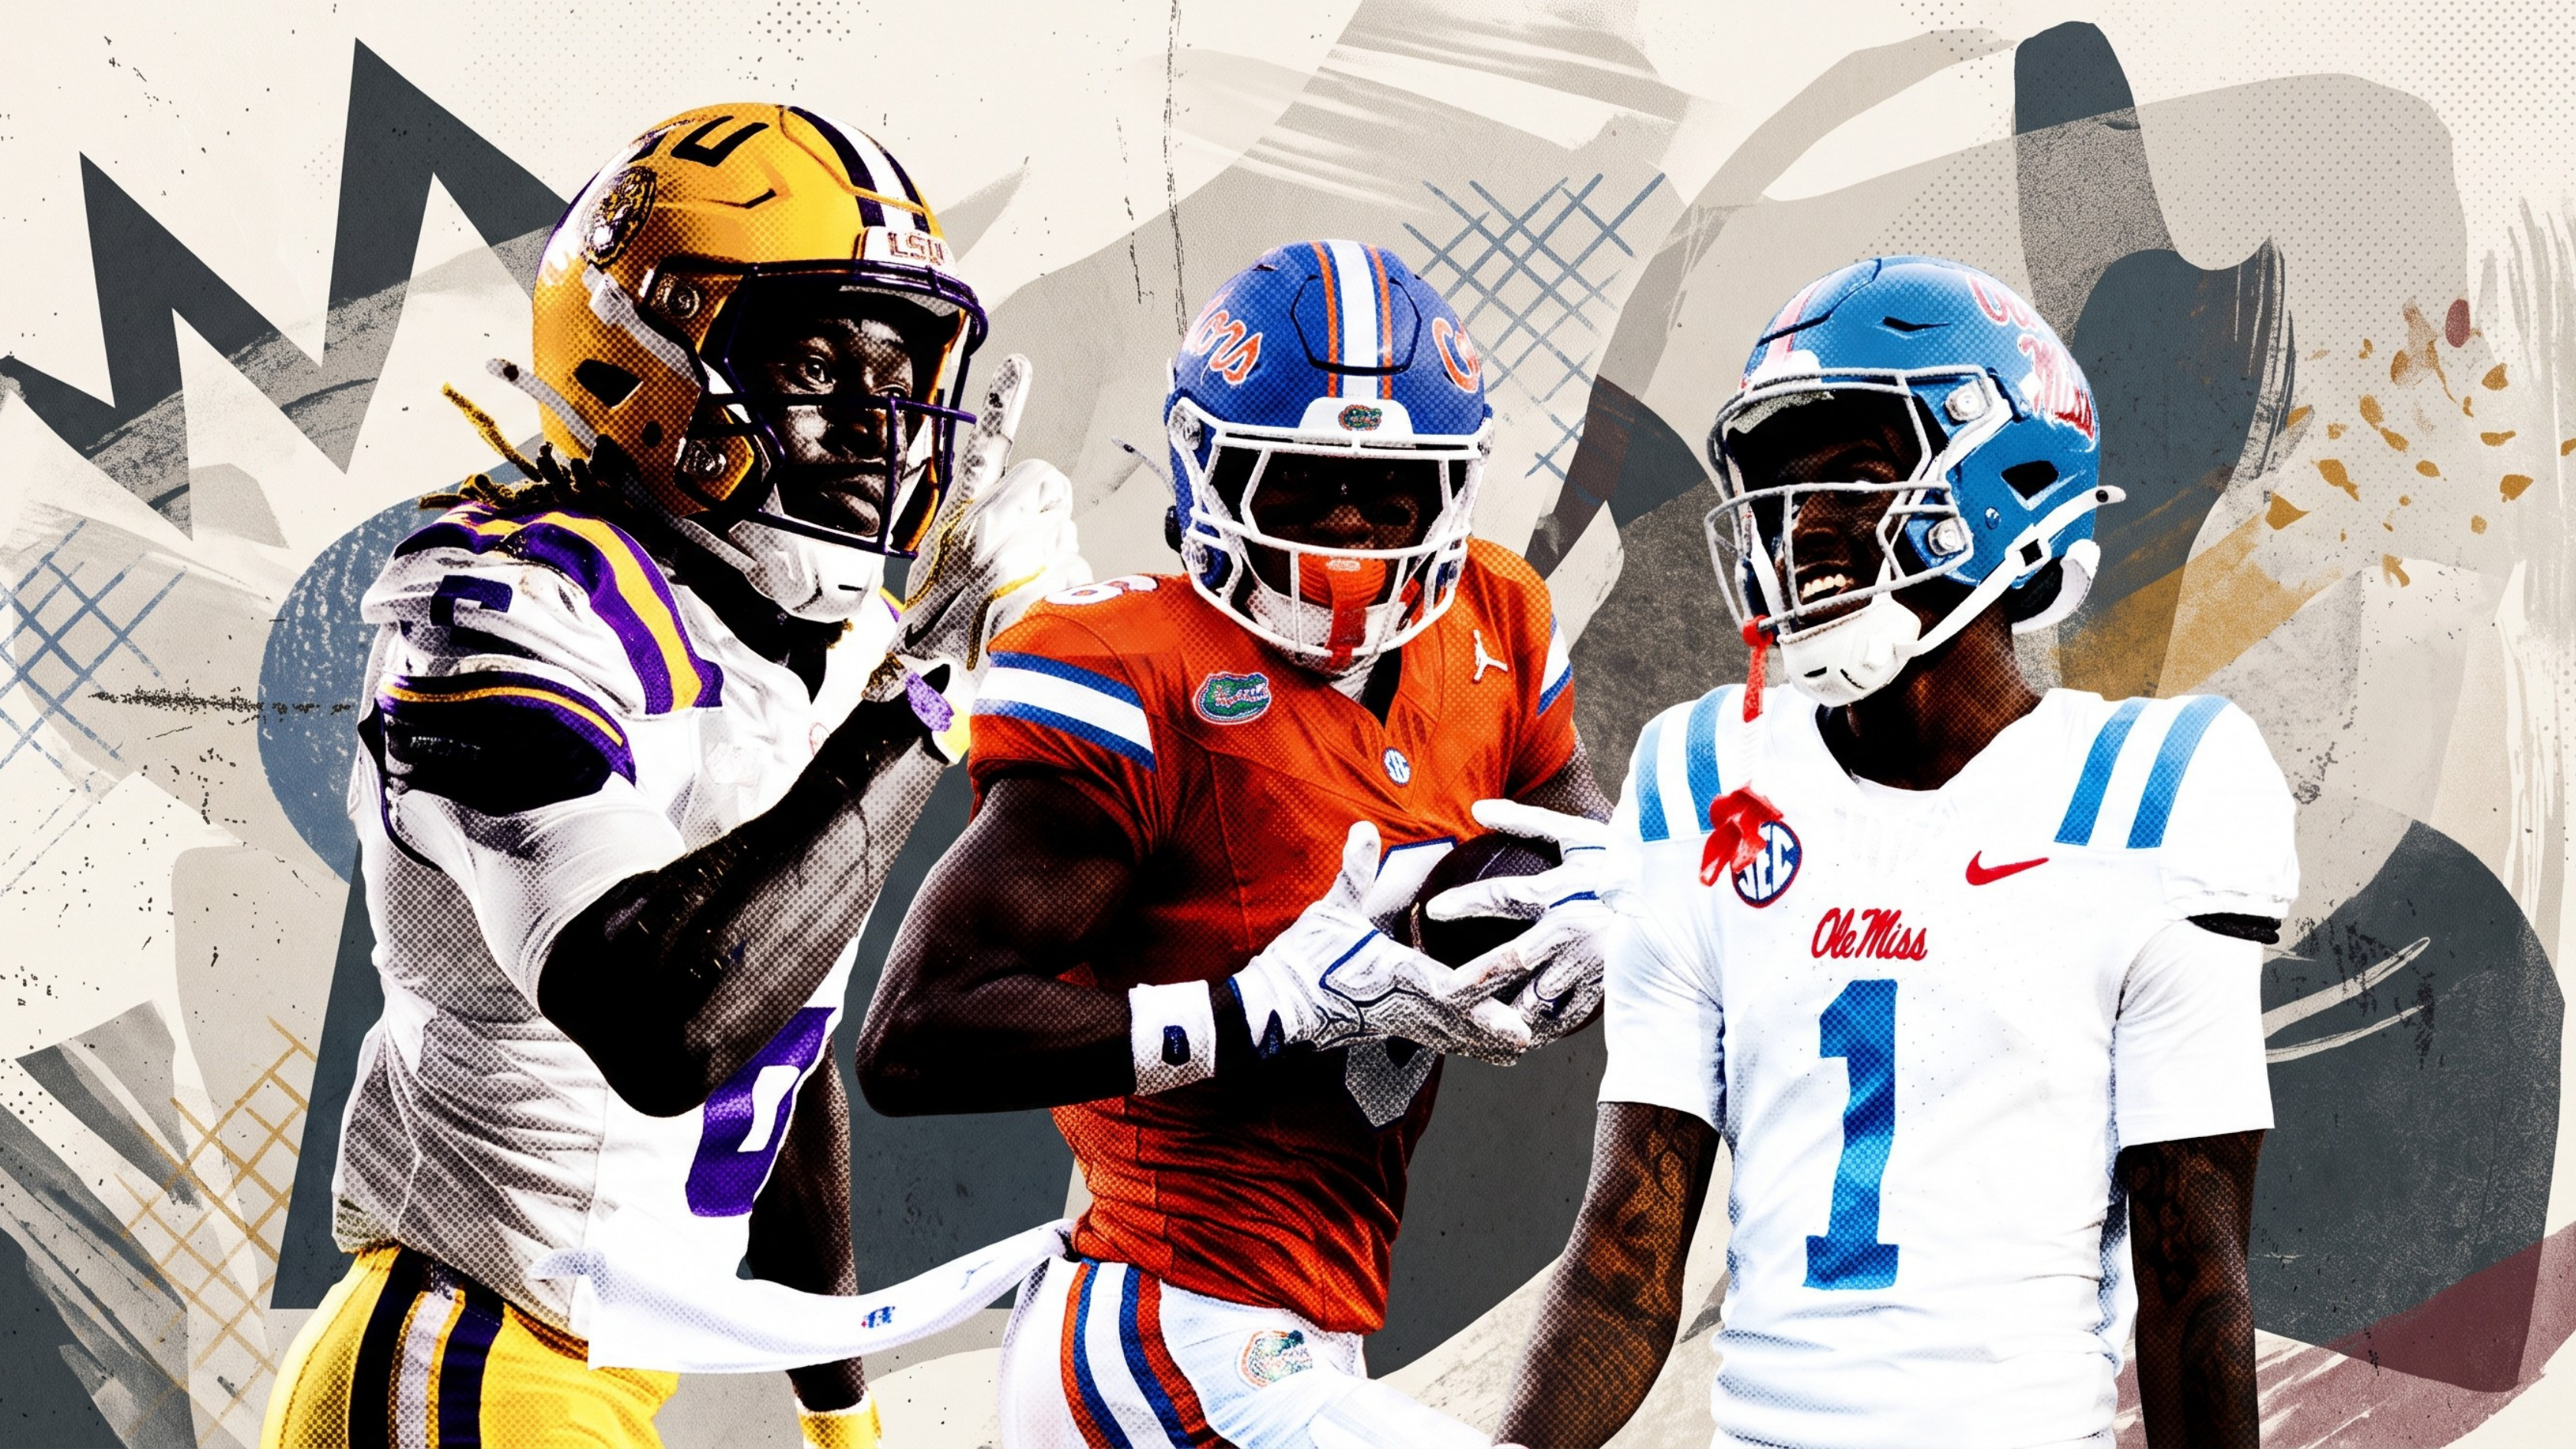
Flooding the SEC
6 Ways the Flood Concept Dominates Defenses

Coordinator Corner
A space for football thinkers and system builders. Dial It Up!
cfbfastR EPA/play, success rate, and number of plays by concept type. Choose a metric, then a concept, to sort.
+0.04 54% · 48 | -0.13 49% · 130 | +1.44 50% · 2 | -0.29 54% · 28 | +0.01 45% · 20 | +0.45 62% · 61 | +0.67 49% · 94 | |
-0.16 41% · 115 | +0.00 46% · 39 | +0.22 50% · 16 | +0.19 40% · 15 | -0.67 44% · 18 | -0.08 39% · 31 | +0.06 43% · 176 | |
+0.07 50% · 52 | +0.01 42% · 72 | +0.52 50% · 18 | +0.08 52% · 27 | -0.76 17% · 18 | +0.23 46% · 56 | -0.15 42% · 103 | |
-0.09 47% · 98 | +0.07 47% · 114 | +0.72 67% · 3 | +0.06 61% · 23 | -0.16 46% · 28 | +0.43 53% · 60 | +0.25 49% · 85 | |
+0.34 56% · 86 | -0.01 48% · 85 | -1.16 0% · 2 | +0.02 61% · 33 | -0.18 50% · 18 | +0.29 62% · 58 | +0.53 54% · 69 | |
+0.21 52% · 67 | +0.12 63% · 104 | +0.15 67% · 9 | +0.08 60% · 30 | +0.30 53% · 17 | +0.54 57% · 61 | -0.38 33% · 93 | |
-0.04 46% · 118 | +0.02 52% · 93 | +0.16 52% · 21 | -0.07 54% · 41 | +1.57 75% · 4 | +0.31 49% · 112 | -0.01 51% · 92 | |
+0.08 48% · 69 | -0.17 46% · 41 | +0.09 54% · 50 | +0.12 54% · 50 | -0.24 40% · 5 | +0.22 50% · 74 | +0.44 48% · 67 | |
-0.20 40% · 107 | +0.00 35% · 69 | +0.22 51% · 35 | -0.61 25% · 12 | -0.48 17% · 12 | +0.50 50% · 52 | +0.27 51% · 113 | |
-0.26 31% · 64 | -0.20 43% · 68 | -0.13 40% · 5 | -0.41 50% · 16 | -0.24 19% · 16 | +0.22 45% · 42 | +0.07 47% · 89 | |
+0.19 53% · 64 | +0.20 52% · 54 | +0.24 47% · 15 | +0.05 53% · 43 | -0.46 29% · 7 | +0.17 58% · 71 | +0.44 52% · 77 | |
+0.19 55% · 98 | -0.09 43% · 60 | +0.34 53% · 30 | -0.23 47% · 51 | +0.56 50% · 18 | +0.00 45% · 76 | +0.35 43% · 92 | |
+0.02 33% · 45 | +0.27 57% · 116 | -0.02 43% · 47 | -0.18 42% · 38 | +0.11 43% · 7 | +0.06 48% · 54 | -0.10 40% · 98 | |
-0.05 39% · 75 | +0.15 50% · 76 | -0.12 42% · 12 | +0.29 57% · 30 | -0.27 40% · 5 | +0.20 44% · 45 | -0.01 42% · 106 | |
+0.20 47% · 91 | -0.00 50% · 80 | -0.31 36% · 11 | -0.17 43% · 28 | -0.03 32% · 22 | +0.15 48% · 44 | -0.14 36% · 147 | |
-0.10 42% · 53 | +0.05 42% · 102 | -0.01 25% · 8 | -0.28 47% · 17 | -0.15 38% · 16 | +0.10 44% · 43 | +0.28 42% · 139 |
Members
6 Ways the Flood Concept Dominates Defenses

Members
Article

Members · Oct 6, 2026
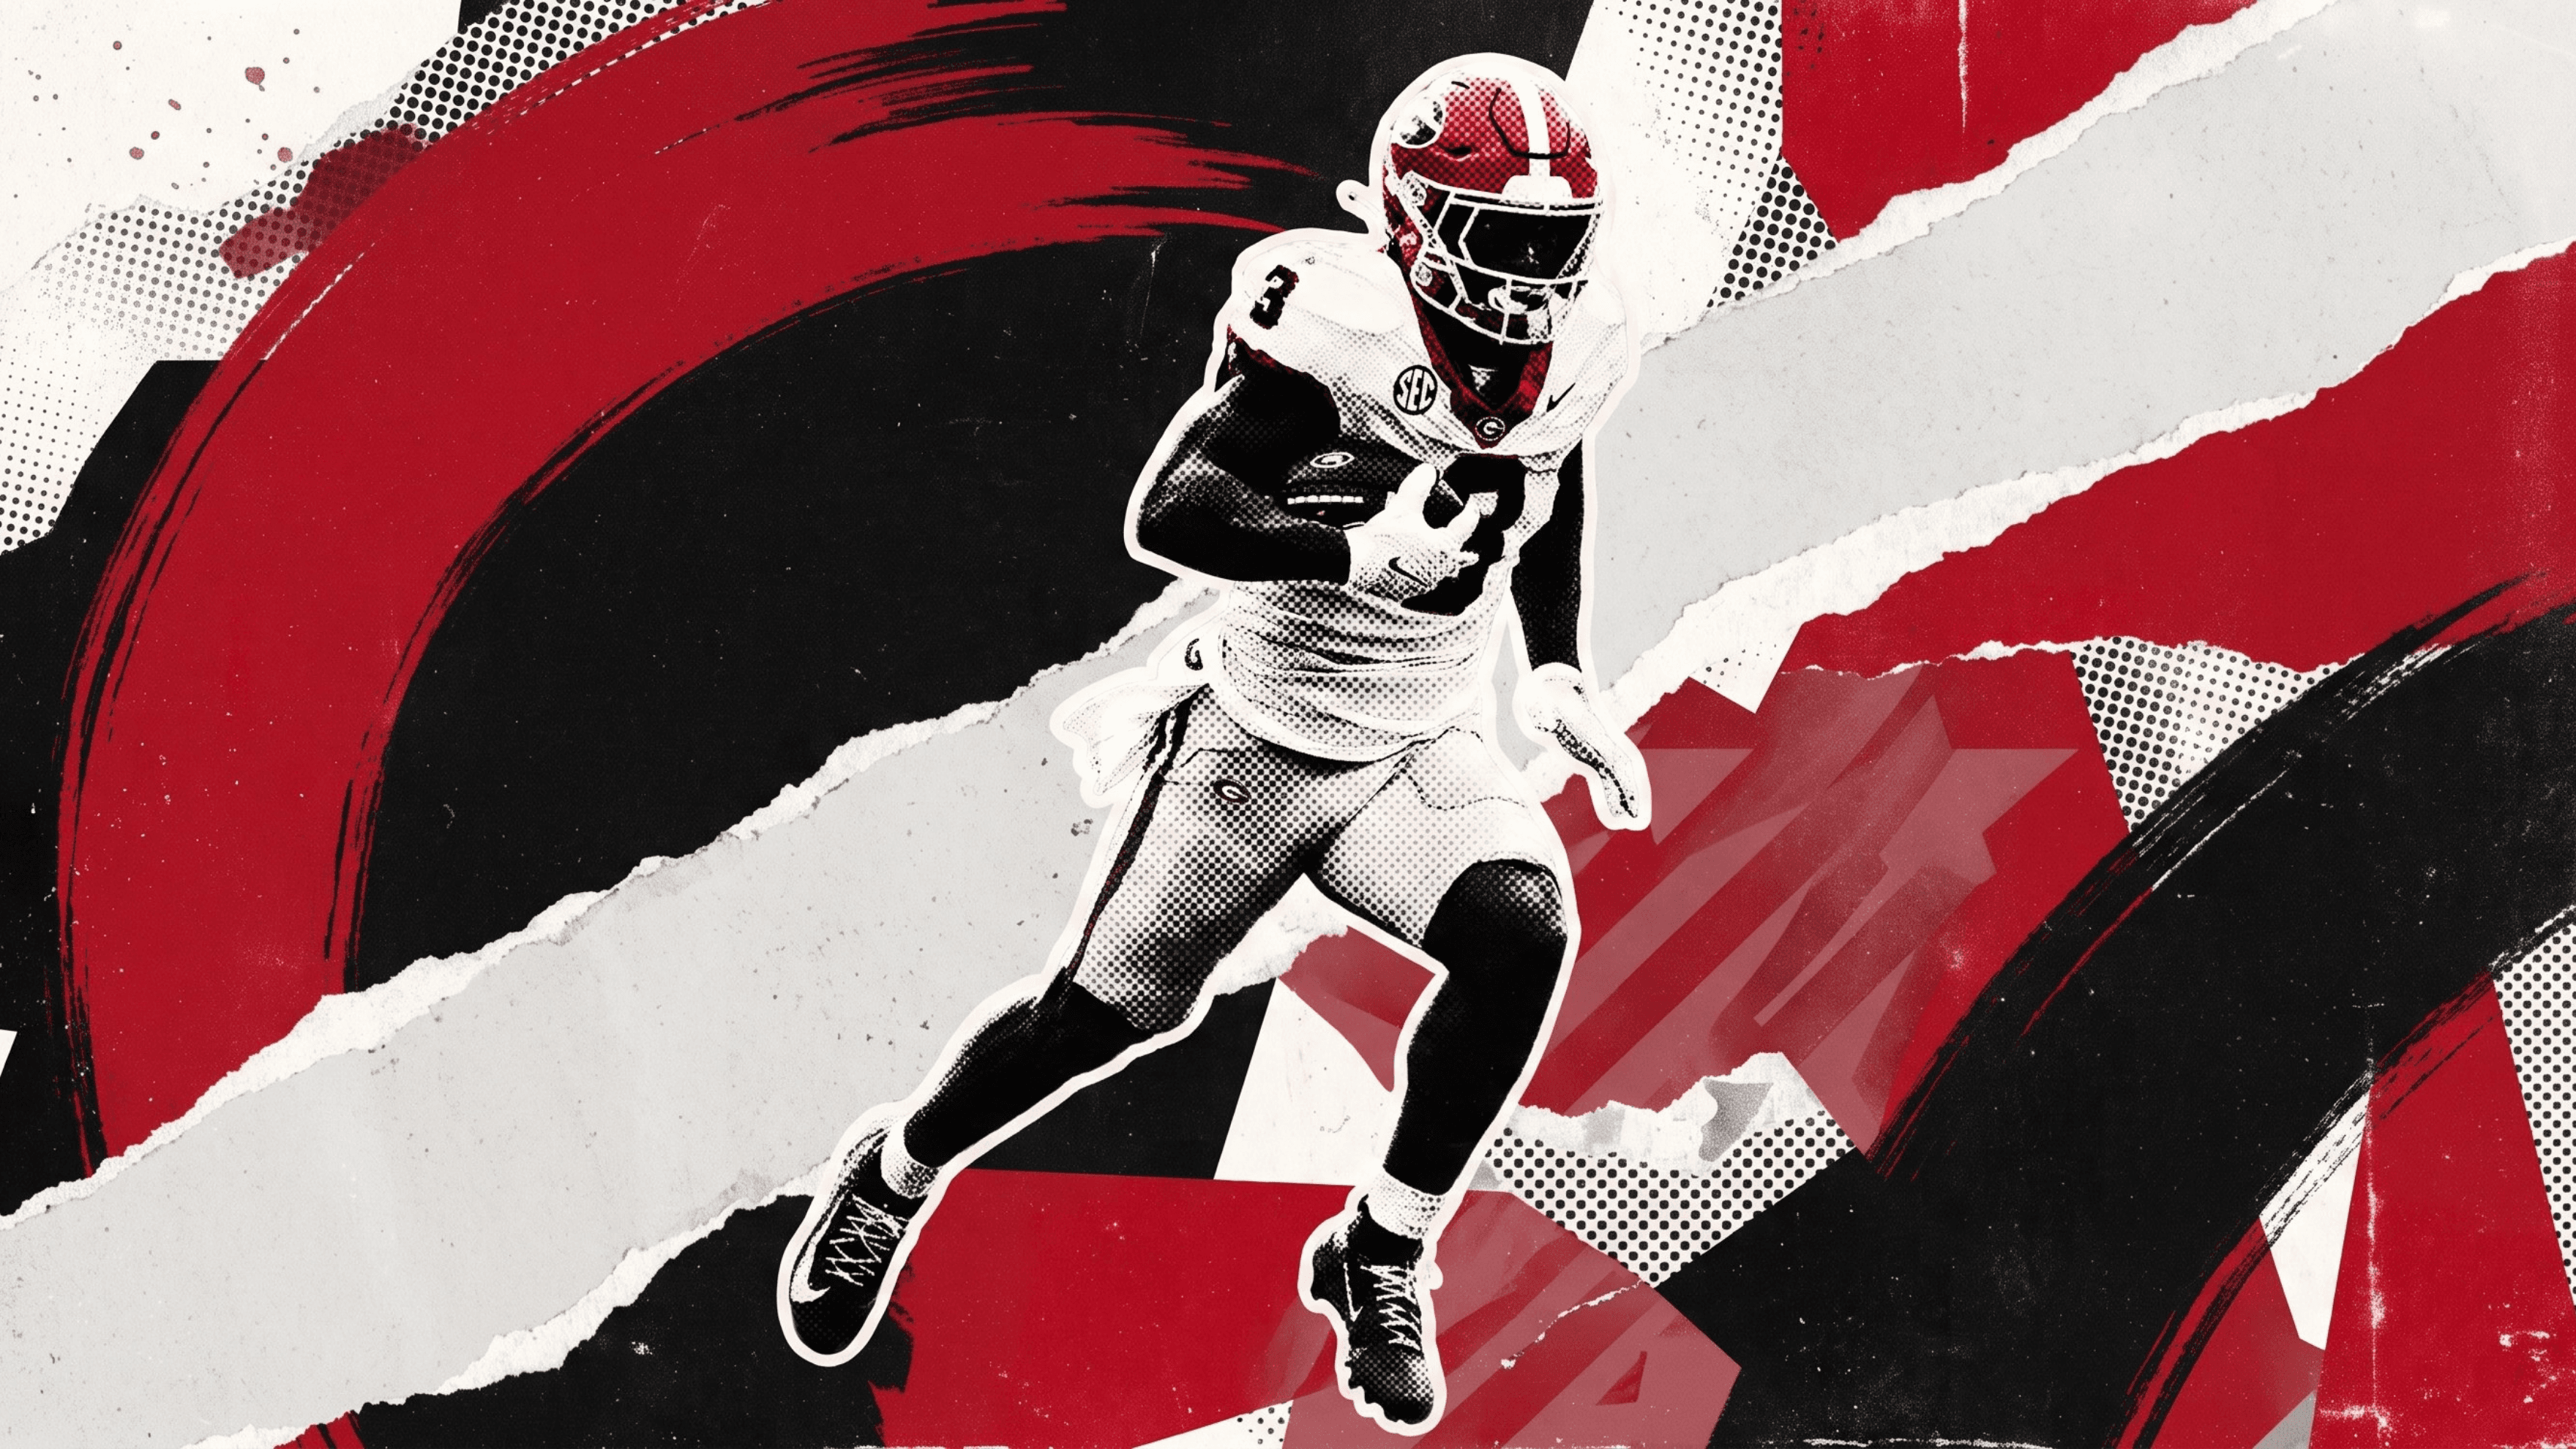
How Missouri OC Chip Lindsey Dials Cayden Lee Open
Missouri wide receiver Cayden Lee ranks third in the SEC with 522 receiving yards, racking up those numbers on 35 catches (14.9 yards per reception) and 4 touchdowns.
Read article →
Article · Oct 2, 2026
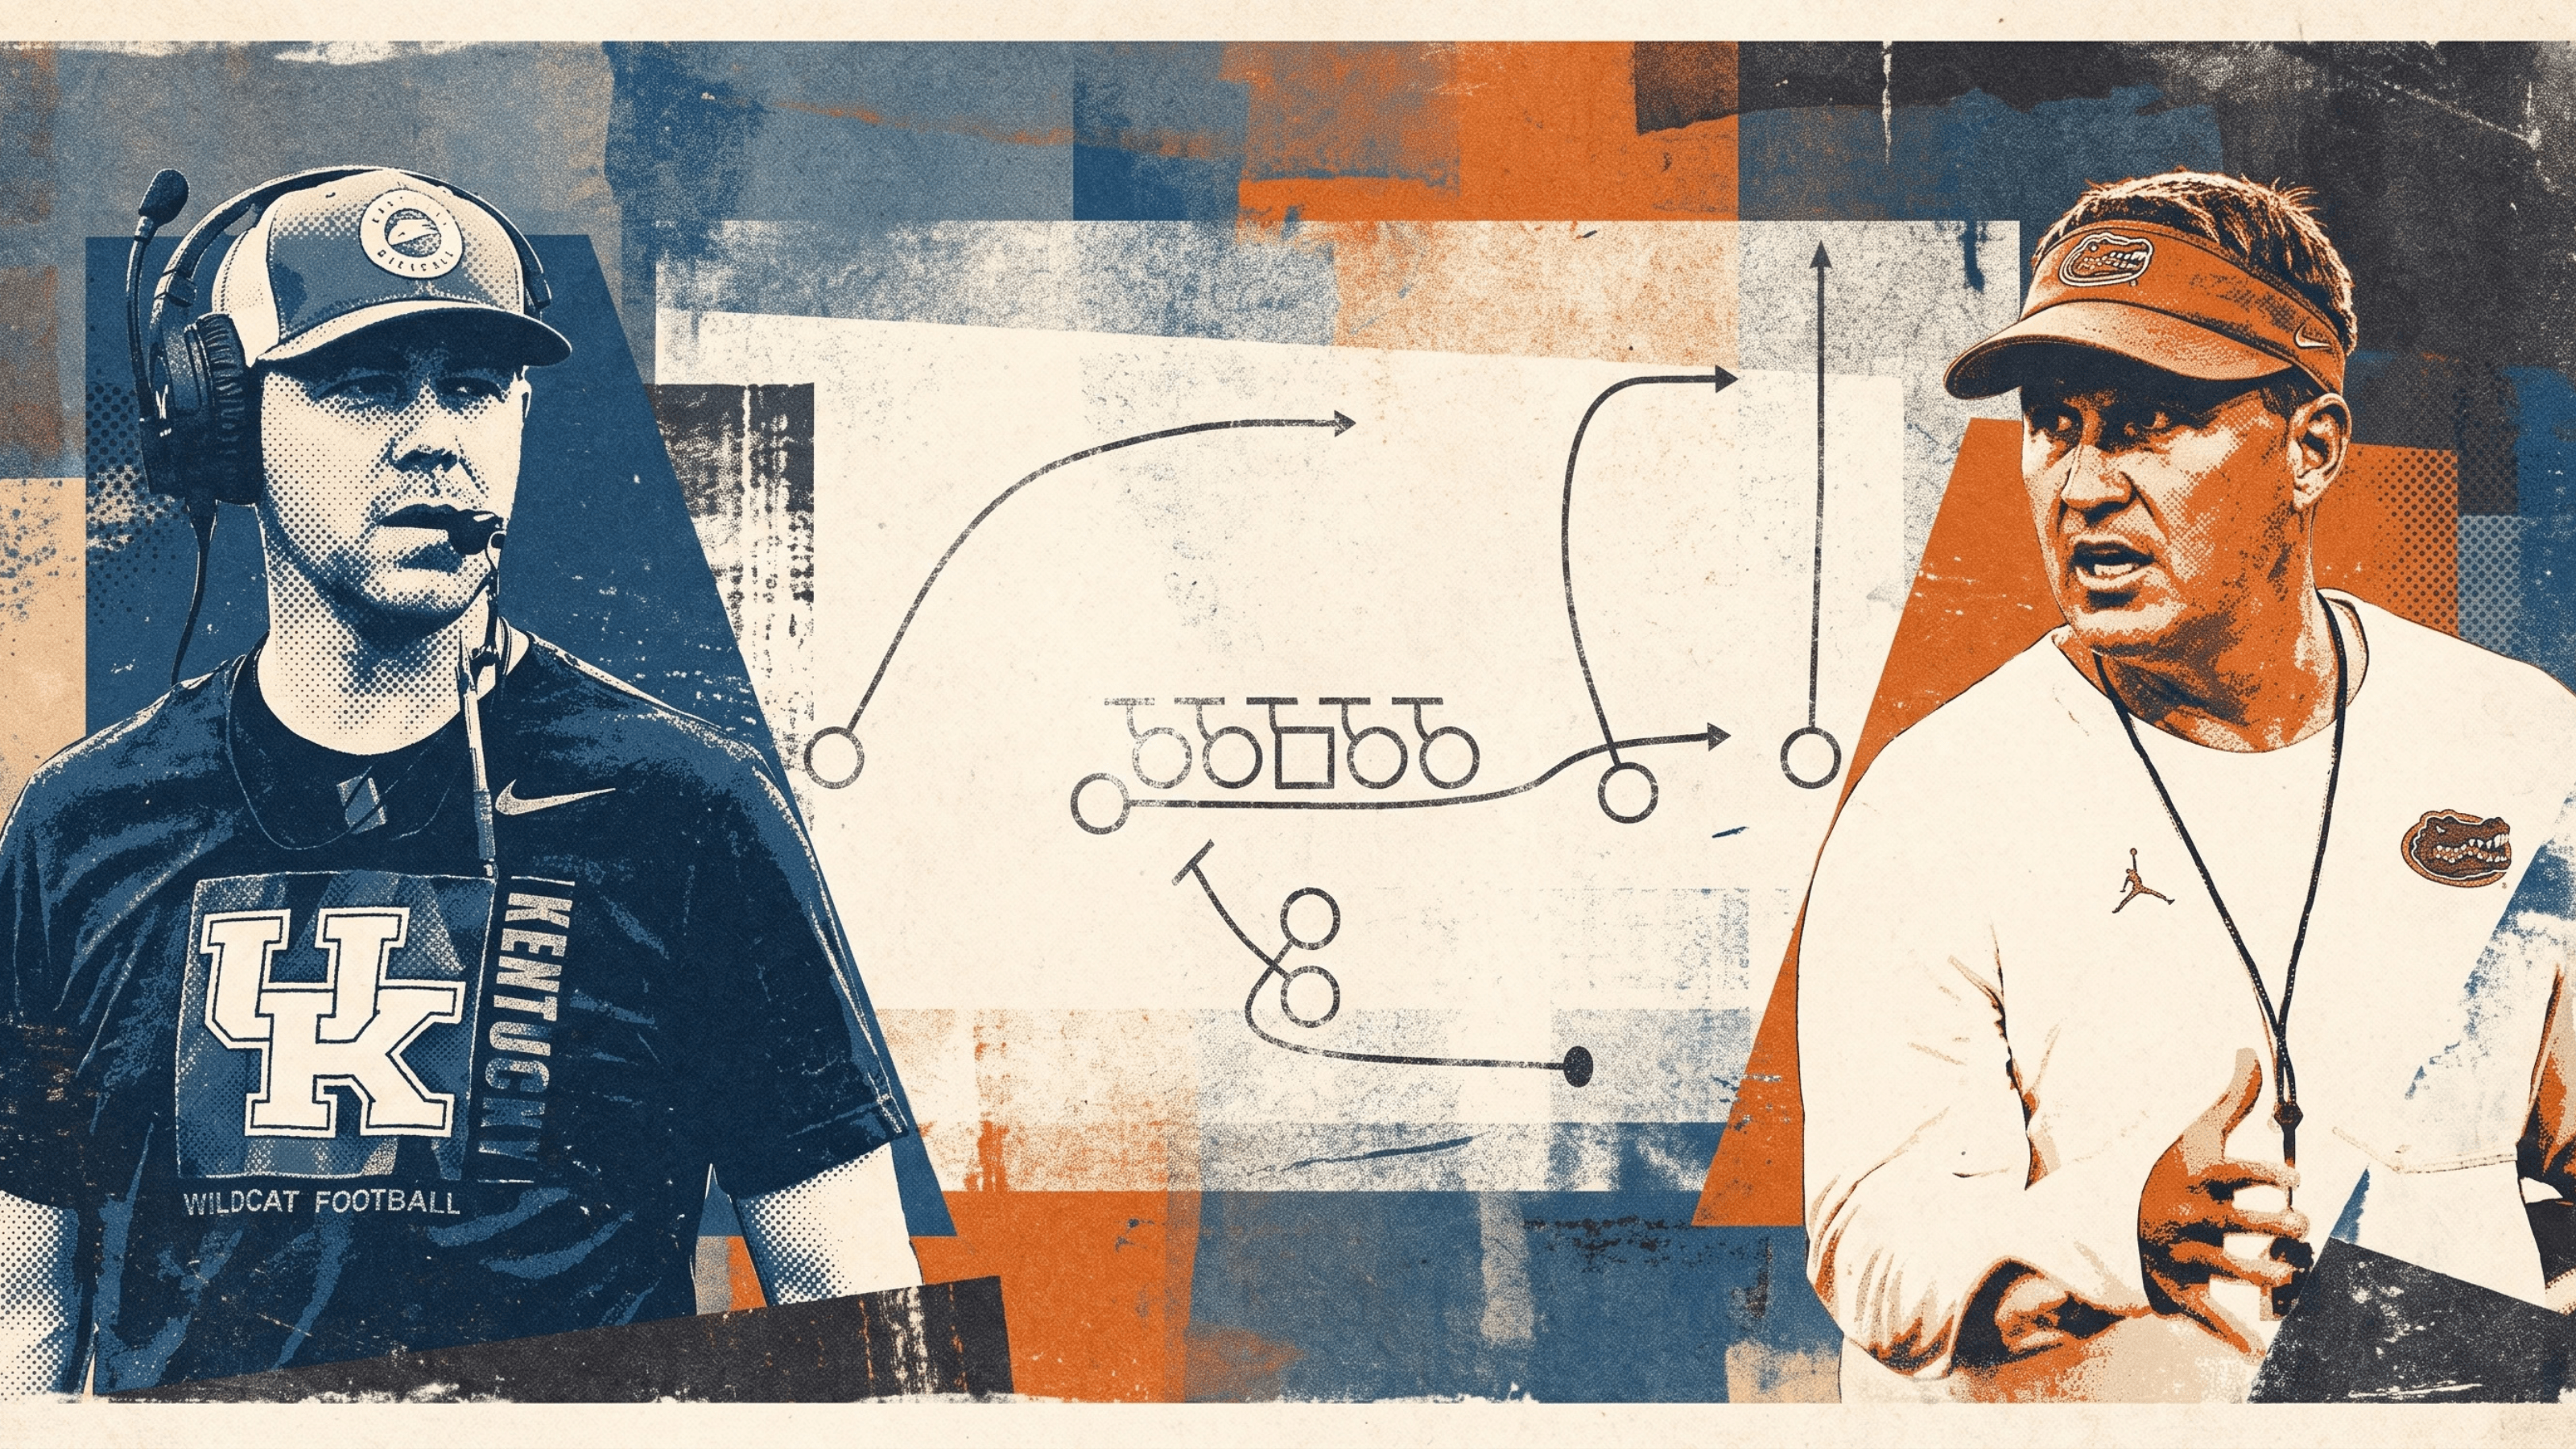
10 Reasons SEC Play-Callers are Dialing Up Slide Routes
All the top SEC offenses are incorporating Slide routes into their offense, and they are reaping the benefits. Approximately 70 Slide routes have been thrown, resulting in an impressive 84.3% completion rate. These routes average 5.16 yards per attempt. Despite their relatively low explosive rate of 6.94%, Slide routes offer a low-risk, high-reward elem…
Read article →
Members · Sep 29, 2026
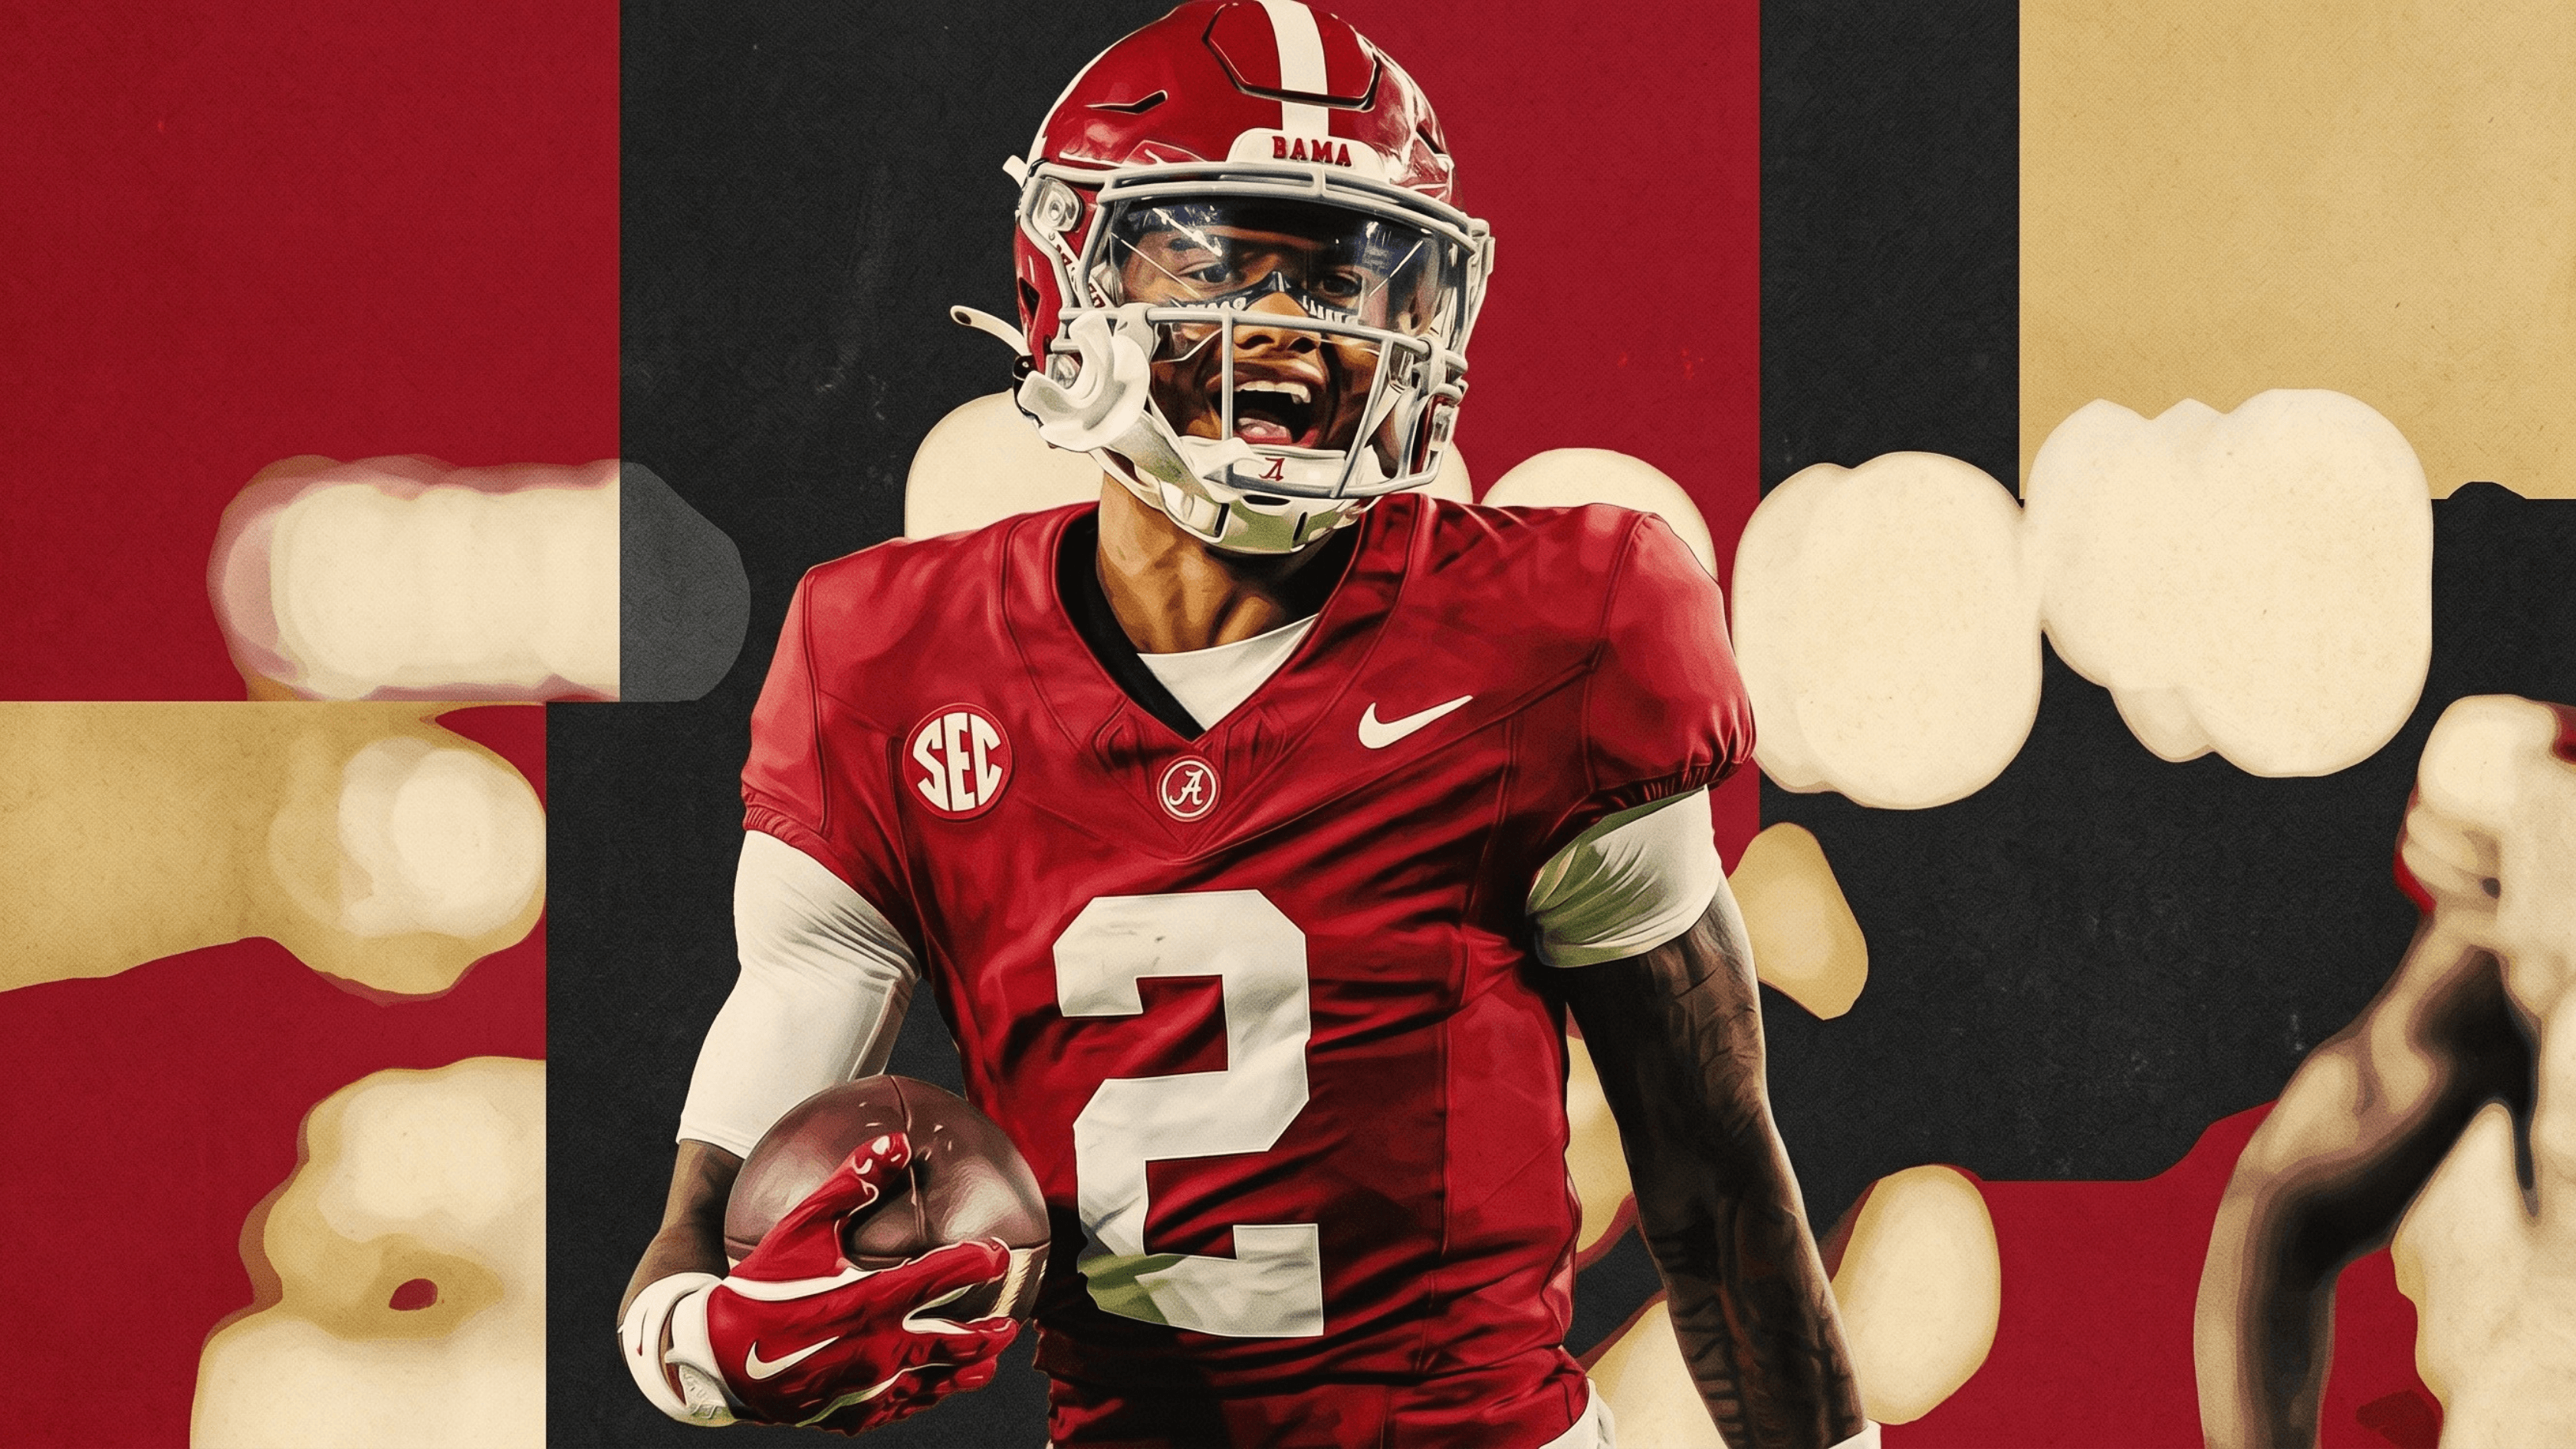
Breaking Down Ryan Grubb’s Coverage Beaters
Alabama’s passing attack has been exceptionally impressive throughout the first four weeks of the 2026 season. They average 10.1 yards per attempt, a remarkable 70.5% completion rate, and lead the SEC with a +0.66 EPA/play per dropback.
Read article →

Members · Sep 25, 2026
How Heupel is Utilizing Tight Ends in the Run Game
Outside of the service academies, Tennessee leads the FBS in rushing with 298.7 yards per game. Josh Heupel and his staff have built an elite offensive machine in Knoxville predicated on establishing the run. Through three weeks, the Vols are averaging 44.3 carries per game at a dominant 6.74 yards per carry.
Read article →

Members · Sep 21, 2026
How Florida’s Buster Faulkner Sets Up Play-Actions
Florida’s new offensive coordinator, Buster Faulkner, is widely regarded as one of the top offensive coordinators in the country. In 2025, he led Georgia Tech to the 11th highest average yards per game (460 yards per game). Through just three games this season, he has already amassed the 3rd highest average yards per game (544.3 yards per game) for Florida.
Read article →

Members · Sep 17, 2026
Inside Tim Beck’s Belly G Concept at Vanderbilt
Vanderbilt OC Tim Beck, who was a part of the Split Back Veer offense at Pittsburg State, has since transitioned to a spread model. While the Veer elements, including their Belly G concept, remain integral to his Vanderbilt offense, the team is expected to adopt a more open approach. This change is partly due to the recent selection of 5-star Jared Curtis as the starting quarterback. Nevertheless, Belly G will continue to play a crucial role in their strategy, especially in short-yardage situations, as it has consistently proven to be highly effective for them.
Read article →
X · @CoordCorner
Scheme clips, diagrams, and daily coaching notes.
Open on X →
TikTok · @coordcorner
@coordcorner 7473 Followers, 159 Following, 127.8k Likes - Watch awesome short videos created by Coordinator Corner
Open on TikTok →
Instagram · @coordcorner
Stills, reels, and behind-the-whiteboard looks.
Open Instagram →